Map of Twin Buttes
Michaelan Apted
Derek Junttonen
Reed Frey
Garrett Hagen
Max Martinez
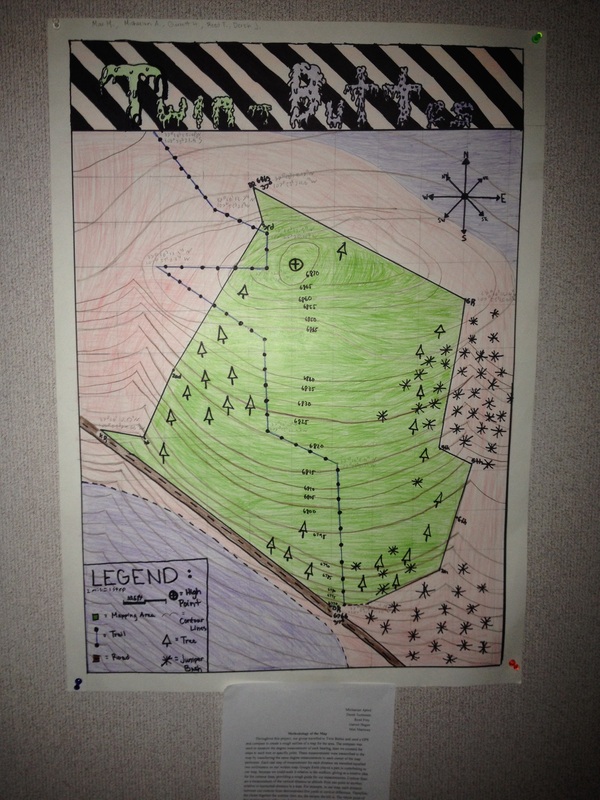
Methodology of the Map
Throughout this project, our group travelled to Twin Buttes and used a GPS and compass to create a rough outline of a map for the area. The compass was used to measure the degree measurement of each bearing, then we counted the steps to each turn or specific point. These measurements were transcribed to the map by transferring the same degree measurements to each corner of the map perimeter. Each real step of measurement for each distance we travelled equalled two millimeters on our written map. Google Earth played a part in contributing to our map, because we could scale it relative to the seafloor, giving us a relative idea for the contour lines, providing a rough guide for our measurements. Contour lines are a measurement of the vertical distance or altitude from one point to another, relative to horizontal distance in a map. For example, in our map, each distance between our contour lines demonstrated five yards in vertical difference. Therefore, the closer together the contour lines are, the steeper the hill is. The whole point of this project was to refine our spatial awareness. Using tools as well as our own perception, we were able to measure and record the distance between landmarks along the trail, such as the spraypainted rocks, or turns in the bike trail. We also used the bearings and paces we took to realistically represent the distances between things on our map.
Derek Junttonen
Reed Frey
Garrett Hagen
Max Martinez
Methodology of the Map
Throughout this project, our group travelled to Twin Buttes and used a GPS and compass to create a rough outline of a map for the area. The compass was used to measure the degree measurement of each bearing, then we counted the steps to each turn or specific point. These measurements were transcribed to the map by transferring the same degree measurements to each corner of the map perimeter. Each real step of measurement for each distance we travelled equalled two millimeters on our written map. Google Earth played a part in contributing to our map, because we could scale it relative to the seafloor, giving us a relative idea for the contour lines, providing a rough guide for our measurements. Contour lines are a measurement of the vertical distance or altitude from one point to another, relative to horizontal distance in a map. For example, in our map, each distance between our contour lines demonstrated five yards in vertical difference. Therefore, the closer together the contour lines are, the steeper the hill is. The whole point of this project was to refine our spatial awareness. Using tools as well as our own perception, we were able to measure and record the distance between landmarks along the trail, such as the spraypainted rocks, or turns in the bike trail. We also used the bearings and paces we took to realistically represent the distances between things on our map.